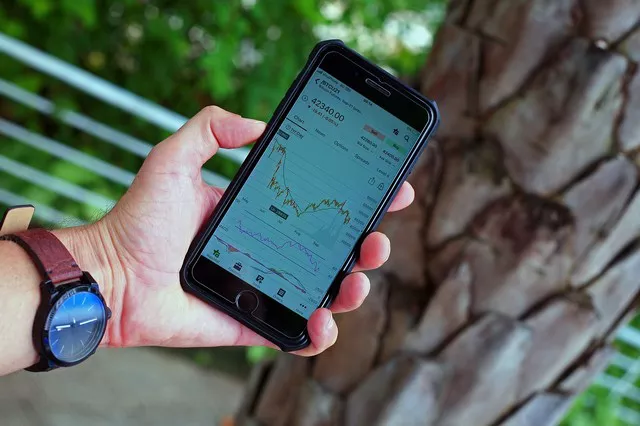
Technical indicators play a crucial role in analyzing and predicting price movements in futures trading. By using the right combination of indicators, traders can gain valuable insights and make informed trading decisions. In this article, we will explore some of the best technical indicators for futures trading, helping you enhance your trading strategy and increase your chances of success.
Moving Averages
Moving averages are popular and versatile technical indicators used in futures trading. They smooth out price data and help identify trends. Common types include the simple moving average (SMA) and the exponential moving average (EMA). Traders often use moving averages to determine trend direction, support and resistance levels, and potential entry or exit points.
Relative Strength Index (RSI)
The Relative Strength Index (RSI) is a momentum oscillator that measures the speed and change of price movements. It ranges from 0 to 100 and helps traders identify overbought and oversold conditions in the market. The RSI can indicate potential trend reversals or confirm the strength of an existing trend, providing valuable signals for entry or exit decisions.
Bollinger Bands
Bollinger Bands consist of a middle band (usually a moving average) and two outer bands that represent standard deviations from the middle band. These bands dynamically adjust to market volatility. Bollinger Bands are effective in identifying periods of low volatility followed by potential breakouts. Traders often use them to spot overbought and oversold conditions and anticipate trend reversals.
Moving Average Convergence Divergence (MACD)
The Moving Average Convergence Divergence (MACD) is a trend-following momentum indicator that consists of two lines, the MACD line and the signal line. It helps identify potential trend changes, bullish or bearish crossovers, and divergence between price and indicator movements. Traders use the MACD to generate buy or sell signals and confirm the strength of a trend.
Fibonacci Retracement
Fibonacci retracement is a technical analysis tool based on the Fibonacci sequence. It helps identify potential support and resistance levels and predicts the extent of price retracements within a trend. Traders use Fibonacci retracement levels, such as 38.2%, 50%, and 61.8%, to find optimal entry or exit points, aligning with the overall trend direction.
Volume Profile
Volume profile displays the volume traded at specific price levels over a given period. It helps traders understand the distribution of volume and identify significant price levels where price action may encounter support or resistance. Traders use volume profile to validate breakouts, assess market sentiment, and spot areas of high trading activity.
Stochastic Oscillator
The Stochastic Oscillator is a momentum indicator that compares the closing price of a futures contract to its price range over a specified period. It helps identify overbought and oversold conditions and potential trend reversals. Traders use the Stochastic Oscillator to generate buy or sell signals when the indicator crosses specific threshold levels.
Average True Range (ATR)
The Average True Range (ATR) measures market volatility by calculating the average range between the high and low prices over a specified period. It helps traders determine stop-loss levels and assess the potential profit targets. A higher ATR indicates higher volatility, while a lower ATR suggests lower volatility.
Ichimoku Cloud
The Ichimoku Cloud is a comprehensive indicator that provides a holistic view of price action, support and resistance levels, and trend direction. It consists of multiple components, including the cloud, the Tenkan-sen, and the Kijun-sen lines. Traders use the Ichimoku Cloud to identify trend reversals, confirm trends, and generate entry or exit signals.
Conclusion
Using the right technical indicators can significantly enhance your futures trading strategy. However, it’s important to remember that no single indicator guarantees success. Traders should experiment with different combinations of indicators, understand their strengths and limitations, and adapt their approach based on market conditions. By incorporating the best technical indicators for futures trading into your strategy, you can gain a competitive edge and improve your overall trading performance. Remember to practice proper risk management and continually educate yourself to stay ahead in the dynamic world of futures trading.


