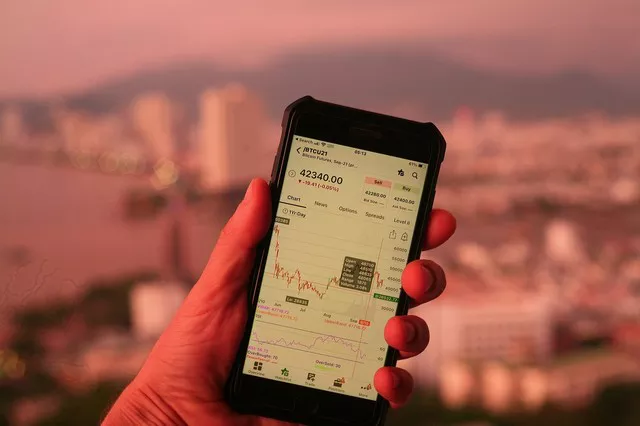
Futures charts are essential tools for traders to analyze and interpret price movements, identify trends, and make informed trading decisions. Understanding how to read and interpret futures charts is crucial for successful trading in the futures market. In this comprehensive guide, we will walk you through the process of reading futures charts, covering key components, chart types, technical indicators, and practical tips to enhance your chart analysis skills.
Key Components of a Futures Chart
Price Axis:
Vertical Axis: Represents the price levels of the futures contract.
Scale: The scale can be linear or logarithmic, depending on the price movement characteristics of the contract.
Time Axis:
Horizontal Axis: Displays the timeline of the chart, ranging from minutes to years.
Timeframes: Different timeframes (e.g., 1-minute, 5-minute, daily) provide varying levels of detail and are suitable for different trading strategies.
Candlesticks or Bars:
Candlestick Chart: Each candlestick represents a specific timeframe and displays the opening, closing, high, and low prices.
Bar Chart: Similar to candlesticks, bars represent the same price information but in a different visual format.
Types of Futures Charts
Line Charts:
Simple and basic representation of price movements.
Plots the closing prices of the futures contract over time.
Useful for identifying long-term trends and support/resistance levels.
Candlestick Charts:
Provides more detailed information about price action compared to line charts.
Shows the relationship between opening, closing, high, and low prices within a specific timeframe.
Helps identify market sentiment, trend reversals, and potential trading opportunities.
Bar Charts:
Similar to candlestick charts but represented as vertical lines with horizontal dashes.
Display opening, closing, high, and low prices within a specific timeframe.
Useful for analyzing price volatility and key price levels.
Technical Indicators
Moving Averages:
Simple Moving Average (SMA): Calculates the average price over a specific period.
Exponential Moving Average (EMA): Gives more weight to recent price data.
Helps identify trends, support/resistance levels, and potential entry/exit points.
Oscillators:
Relative Strength Index (RSI): Measures the speed and change of price movements.
Stochastic Oscillator: Indicates overbought and oversold conditions.
Helps identify potential reversals and divergences.
Volume Indicators:
Volume Bars: Represents the volume of trades executed during a specific timeframe.
Helps gauge market participation, confirm price trends, and identify potential reversals.
Chart Analysis Techniques
Trend Analysis:
Identify the overall trend using trendlines, moving averages, or trend-following indicators.
Determine the direction of the trend (upward, downward, or sideways) to align trading strategies accordingly.
Support and Resistance Levels:
Identify price levels where the futures contract has historically reversed or stalled.
Use horizontal lines or trendlines to mark significant support and resistance levels.
Chart Patterns:
Head and Shoulders, Double Tops/Bottoms, Triangles, and more.
Provide insights into potential trend reversals or continuation patterns.
Practical Tips for Reading Futures Charts
Multiple Timeframe Analysis:
Analyze charts of different timeframes to gain a comprehensive view of the market.
Use longer timeframes for trend identification and shorter timeframes for precise entry/exit points.
Combine Chart Patterns with Indicators:
Confirm chart patterns with technical indicators to increase the accuracy of your analysis.
Look for confluence between pattern formations and indicator signals.
Practice Risk Management:
Set appropriate stop-loss levels based on chart analysis and risk tolerance.
Determine position size based on risk-reward ratios and account balance.
Conclusion
Mastering the art of reading futures charts is a fundamental skill for successful futures trading. By understanding the key components of futures charts, different chart types, and how to interpret technical indicators, traders can gain valuable insights into price movements, identify trends, and make informed trading decisions. Remember to practice, combine various analysis techniques, and incorporate risk management principles to enhance your chart reading skills and increase your chances of profitability in the futures market.


